
Game of Thrones Script Visualizations
By Paul Khawaja
By Paul Khawaja
For this project I created visualizations using a dataset of scripts from the television series, Game of Thrones. The script only includes data from season 1 through 7, so season 8 was (thankfully) not in there. My visualizations aim to answer a few questions ranging from simple to more complex, such as which characters had the most lines (or words?), to how the sentiment of characters changed over time (i.e. over seasons), and finally, which characters were in scenes together, and how often?
I watched Game of Thrones (up until the 7th season, and have been avoiding the 8th) and have been quite a fan. There are plenty of visualizations out there that have looked into various questions, likely including some I’m answering here, so this might have not been the most creative choice of data. However, it does give me a wealth of references to compare to and see how my attempt to present this data turned out. There were some key questions I wanted to answer, which lead me to the following problem statements:
The scope of this project was limited to what was within this data-set, though I did have to do plenty of cleaning and data processing as it was quite limited and a bit poorly put together. This data processing and visualizing involved using Python data science libraries, Gephi, Excel tools, and Tableau. This isn’t a very serious visualization but it may be interesting for Game of Thrones fans.
The original data-set was stored in a .csv file with several variables related to the script lines and who they were spoken by. For this project I only used the following variables from the dataset:
In addition to the above, I created the following with some data-processing using python as well as a bit of manual entry:
My first step in data cleaning was going through the data set in MS Excel and filtering out names that represented non-meaningful characters (e.g. “man”, “commoner”, “guard”, etc.), and sentences spoken by multiple unidentified characters (e.g. “all”, “together”). I also did some manual work to add in the “allegiance” column, which was not too time-consuming after cleaning up. This was based on my knowledge of the series at the end of season 7, and it refers to the most important group/house/organization that the character was allied to at the end of season 7. Due to not wanting too many categories (which will be difficult to visualize), after setting allegiances I combined many that only represented a small number of characters into the “other” category. The removal of some rows did mean that I was breaking up the script somewhat, which would be a slight problem later when developing the network, but I figured by filtering out edges with very low weights (i.e. they characters barely appeared together), I could remove most connections that were created by removing lines.
After sorting out the .CSV file in MS Excel, I did additional data processing in Python to get word counts per sentence and sentiment of sentence (using the TextBlob package). I also used Python to create a file for nodes and edges to later use in Gephi. Python and other files are all available on this project’s GitHub.
To address my first question about character and line count, I wanted my visualizations to allow me to compare if there are clear differences between measuring how much a character talks by line count or word count. To start, I determined the context, user and task as follows:
I created two visualizations, one for line count and another for word count, using Tableau. I opted for a treemap because with a lot of character data an axis-based chart would need too much space and scrolling. A bubble chart was an alternative that would offer similar results, but I felt the treemap was a good way to clearly group up the data by allegiances, as well as clearly show the numerical labels (line or word count) on the larger boxes. You can look at the word count dashboard and line count dashboard or interact with them below:
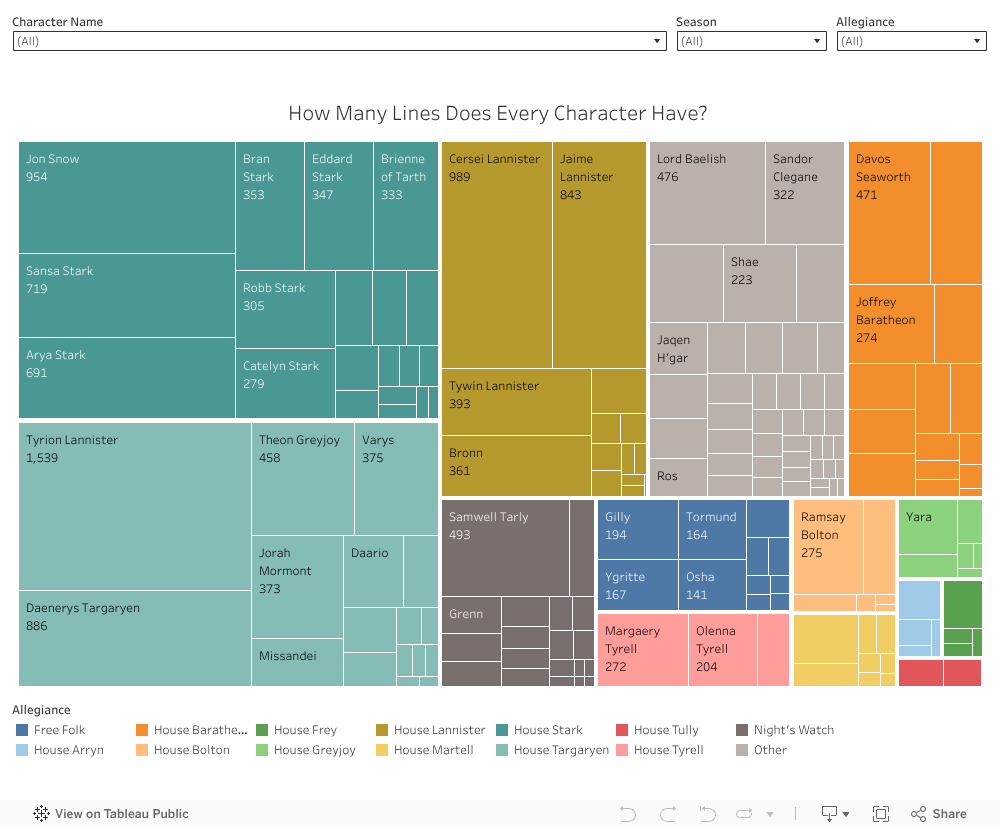
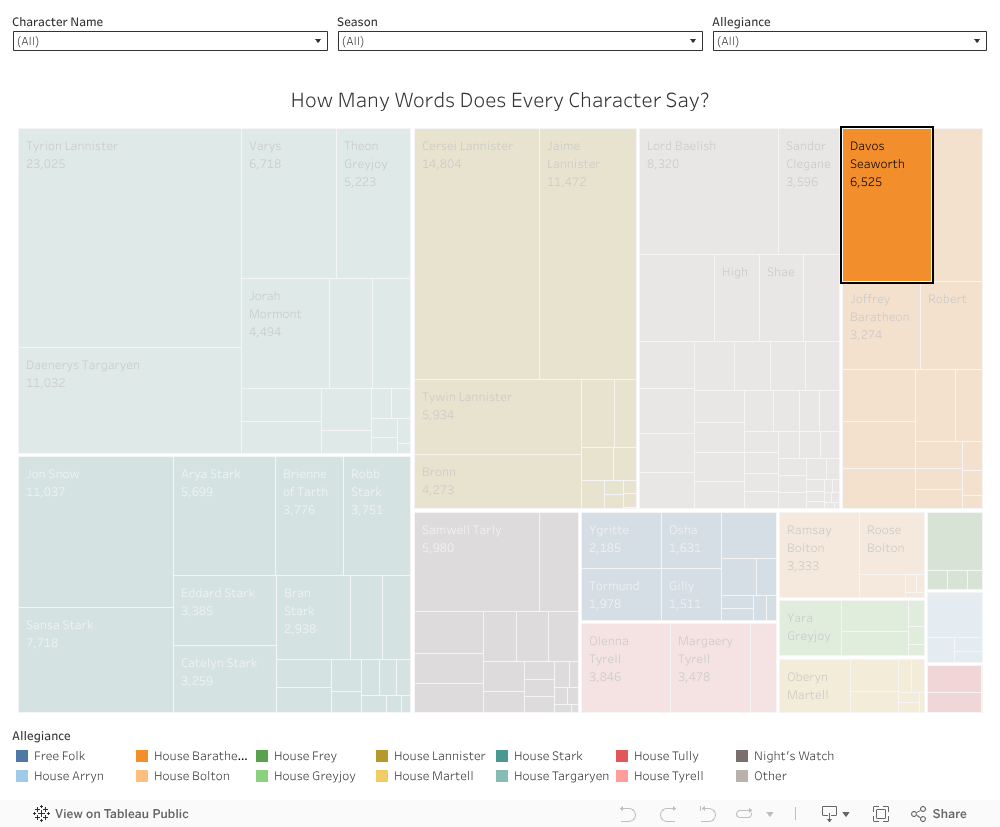
I believe these visualizations compared next to one another do a good job answering the question. They look very similar without any really striking differences. Filtering on specific groups or characters will make the differences seem more pronounced. Perhaps one of the only standouts in this is Lord Baelish, who takes up quite a bit more space in word count than line count. This would probably make sense to most fans, as he has had several monologues throughout the show.
To address the second question of how sentiment changes for important characters over time, I wanted to create something simple that could filter through major characters that appeared in all or most seasons. To start, I determined the context, user and task as follows:
I created one visualization using Tableau. Trying to only display important characters (i.e. ones who actually appeared in all/most seasons) took a bit of work because Tableau is a bit finicky with filters, so I had to create grouped and calculated fields to not have all the characters appear. A line graph made the most sense to display change over time. I also added a bar at 0 to show what is neutral sentiment, as Tableau originally did not emphasize the y-axis = 0. I did consider having two of these graphs appear side-by-side to compare characters, but doing so required a messy work-around in Tableau and I figured anybody interested in a direct visual comparison could just open the dashboard in two screens.
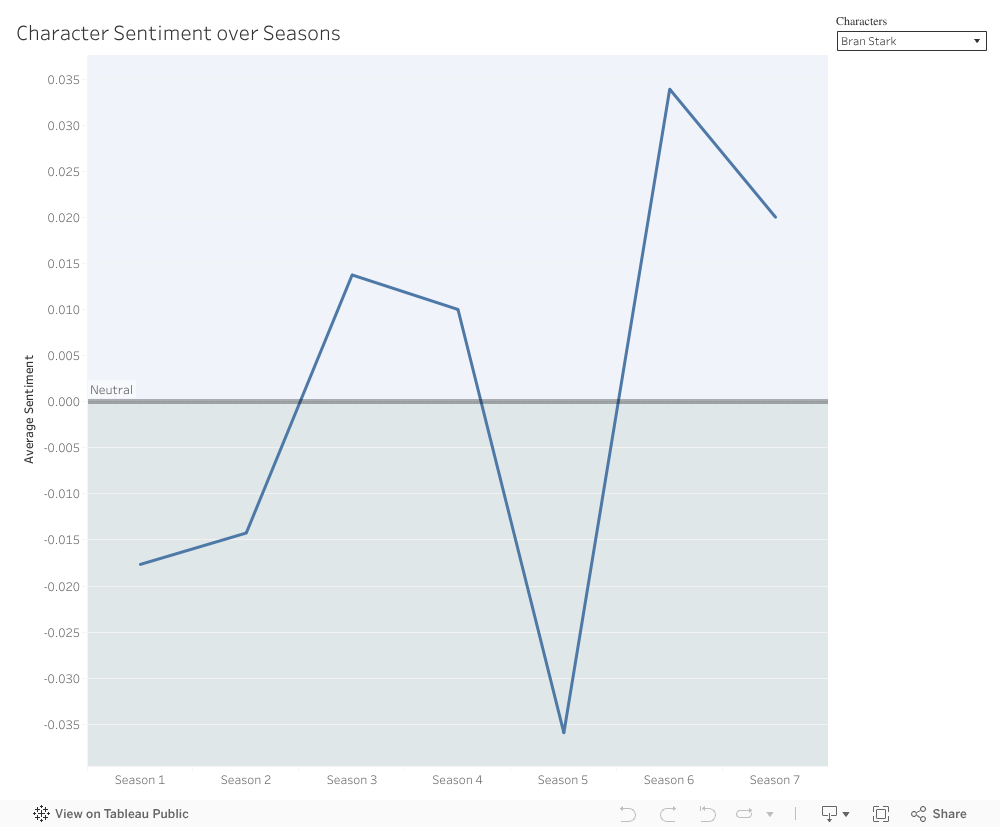
Overall I think this does a good job of representing what I wanted to show. It’s very simple, but that should be the case for displaying specific info without having too much clutter. It was interesting to me to compare, for example, Sandor Clegan’s general negativity to a more outwardly cheerful character like Margaery.
As an aside: this did also reveal some probable mistakes in the dataset, unfortunately, such as Bran Stark having data for Season 5, even though he didn’t appear in the season. It appears his name replaced a character named “Brant”.
My final visualization is an attempt to show which characters have been in scenes together, and how often they’ve communicated. This called for a network graph where characters are nodes and connections represent shared scenes/conversations. I determined the context, user and task as follows:
I created this visual with Gephi after developing node and edge files in the right format using Python. The idea I had was that characters that were in a row next to one another shared a connection or were in the same scene. Of course, this isn’t entirely accurate as it would capture characters whose lines end or begin a scene as connected. To cull a lot of these connections, I figured filtering out small connections would at least get rid of some of the completely invalid ones.
Getting it to look okay in Gephi took a few steps. I installed some plugins to help me both arrange the network in the way I wanted as well as export it as an interactive graph. I started with setting some of the basics in place: allegiance as a modularity class for nodes, distinguished by colors, adjusting edge weights and adding labels, etc. I used some added plugins to change the layout, including one called “Circle Pack” which groups nodes by modularity class. I essentially went back and forth using “Circle Pack” and “Expansion” to resize the packed circles to reduce overlap, and finally used “Label Adjust” so the labels don’t overlap. I then used a plugin called “Sigma.js” to export it as an interactive javascript element that I could embed on a webpage, which is available below:
Unfortunately, the embedding carries very little of the design choices I made within Gephi, which was incredibly frustrating. It did thankfully display it in the layout I wanted, but edge weight, colors, labels, and sizes are not really aligned with how I had designed it. On the plus side, It does have a good search function to allow users to lookup specific characters, as well as a group selector for allegiances. These search tools are nice because it both lists the connections while also highlighting them visually.